Managing large water reservoirs can be challenging over time due to inaccurate or outdated geographic information, resulting in discrepancies between actual and initial design data. To effectively maintain reservoirs, it is essential to use advanced measurement methods, such as mapping with LiDAR scanners and unmanned vehicles that help timely provide accurate monitoring and calculation of water storage volume as well as forecasting and simulation of hydrological conditions.
ABOUT THE PROJECT
In this one-day project, it was demonstrated that the use of a hydrographic USV to obtain underwater mapping and a UAV equipped with a LiDAR scanner to obtain reservoir boundaries and topographic data results in the simplified and efficient management of large water reservoirs. The APACHE 3 USV with single beam echosounder and the AA450 LiDAR scanner installed on the unmanned aerial vehicle were used to perform measurements above and below water level. In addition, a GNSS RTK smart antenna was operated as a base station.
PHASE 1 - CONDUCTING BATHYMETRIC SURVEY
A bathymetric survey consists of three main steps: preparation, measurement, and data processing.
Step 1. Preparation.
Prior to the survey, as no GNSS RTK network was available, it’s necessary to install a GNSS base station, set up control points, and perform site calibration to establish a mapping referentially. For the measurement goals, we can set the route in the software in advance; then, the boat will be measured automatically along the route (what was made in this project), or we can use the remote control to operate the boat during the next step of this survey.
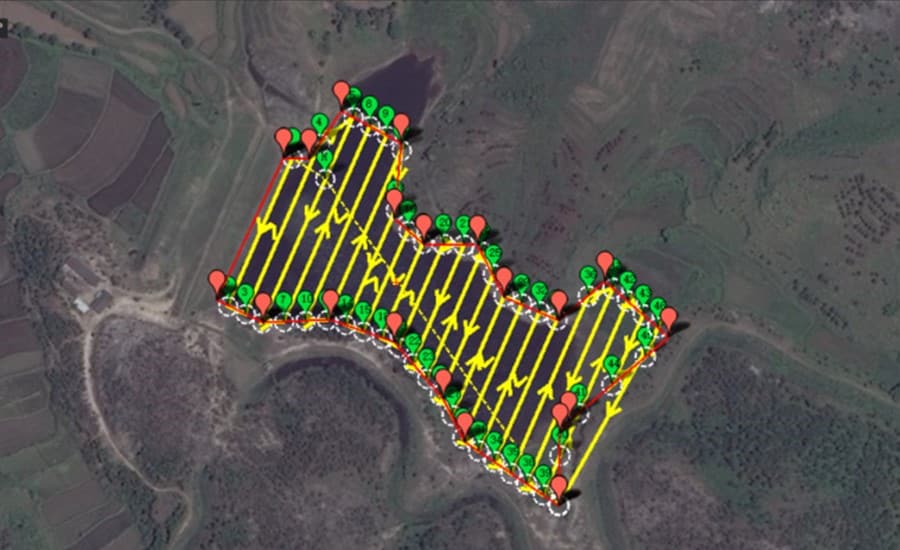
Figure 1. Route planning for the autonomous navigation of the Apache 3 USV.
Step 2. Measurement.
In the process of measurement, the software located the points according to the prescribed route. The distance between the anchor points of the test line was encrypted according to the measurement proportion to ensure that there were points of convergence with the main test line within the specified range. Each inspection line was compared with the crossing points of the main survey line.
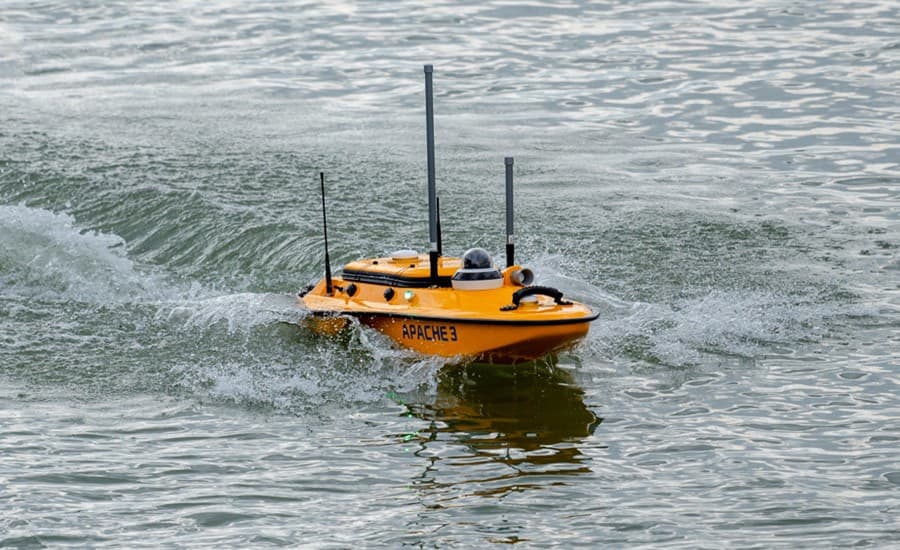
Figure 2. Apache 3 USV marine drone with a single beam echo sounder.
Step 3. Data Processing.
The CHCNAV HydroSurvey 7 software, supplied with the Apache 3 USV, was used to manage raw data collection, mapping, positioning, real-time trajectory display, data processing, and coordinate systems. The software integrates data acquisition and post-processing functions. It supports standard GPGGA and SDDPT water depth data and DWG/DXF format, with layer editing, hiding, and display capabilities.
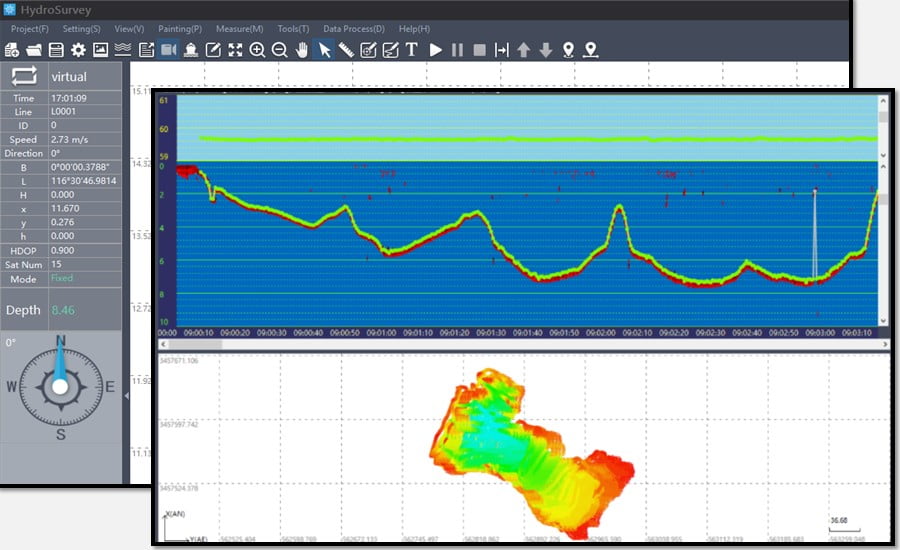
Figure 3. Data processing in HydroSurvey software.
According to the different reservoir areas under different elevations, the corresponding storage capacity was obtained and processed.
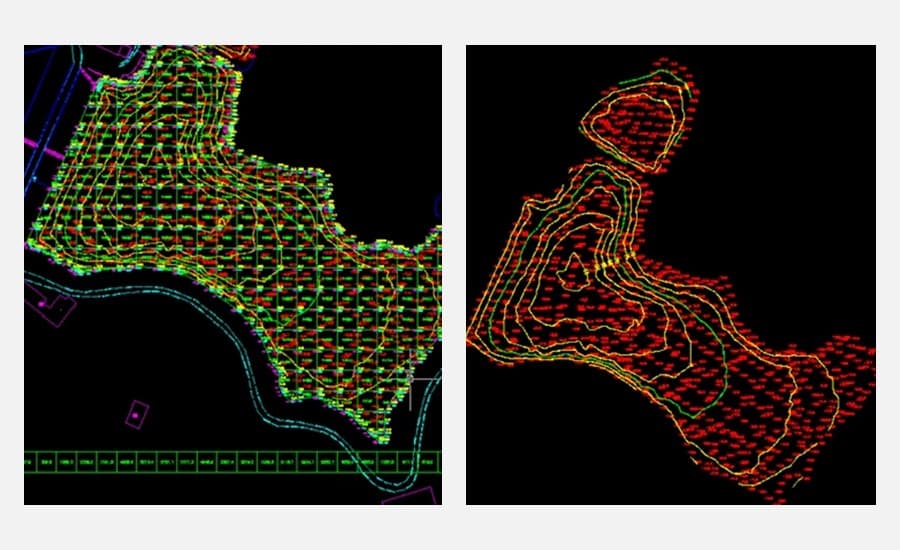
Figure 4. Underwater elevation and calculation of reservoir area and storage capacity.
PHASE 2 - CONDUCTING AIRBORNE SURVEY
As in the previous phase, there are three steps to conduct aerial surveys: preparation, measurement, and data processing.
Step 1. Preparation.
Before collecting scanner and image data with the unmanned aerial vehicle (UAV) carrying the LiDAR+RGB system (Alpha Air 450), installing a GNSS base station in an open sky near the project site was necessary. Depending on the model of the GNSS station used, aerial surveys can be performed in real-time mode or in post-processing mode by recording static data.
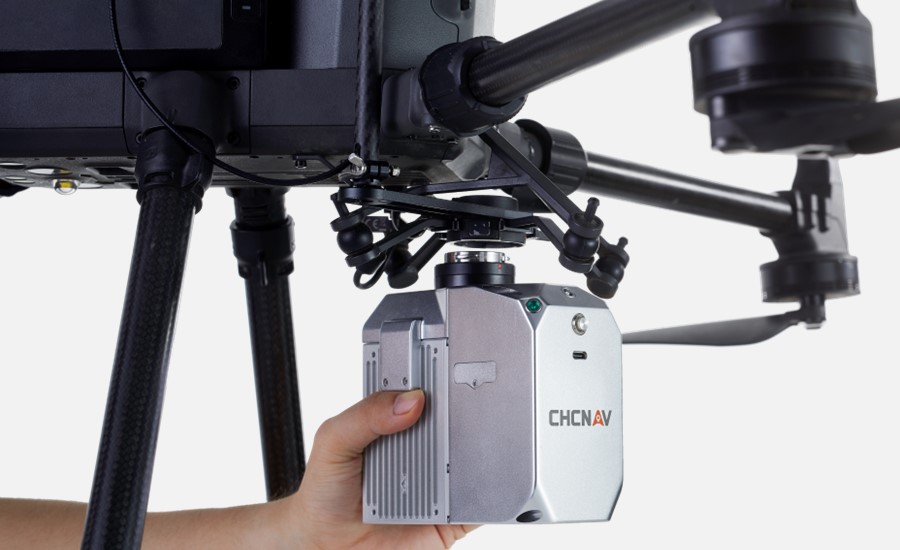
Figure 5. AlphaAir 450 Lidar (AA450) system with built-in IMU, GNSS, 3D scanner and RGB camera.
Step 2. LiDAR Data & Images Acquisition
The AA450 LiDAR scanner features a one-touch workflow control system that allows any survey to be managed with a one-button press. When the aerial data for the project was collected, the CHCNAV CoPre software - a 3D laser scanning pre-processing software supplied with the AA450, was used to transfer the data to the computer via a USB-C cable.
Step 3. Data Processing
In the first step, the CoPre software was used to combine the raw laser data and the POS data to generate georeferenced point cloud data. In a second step, the raw image and POS data were combined to generate a digital orthometric model (DOM). The ground point cloud data was classified in the CoProcess reality capture post-processing software to generate the digital elevation model (DEM).
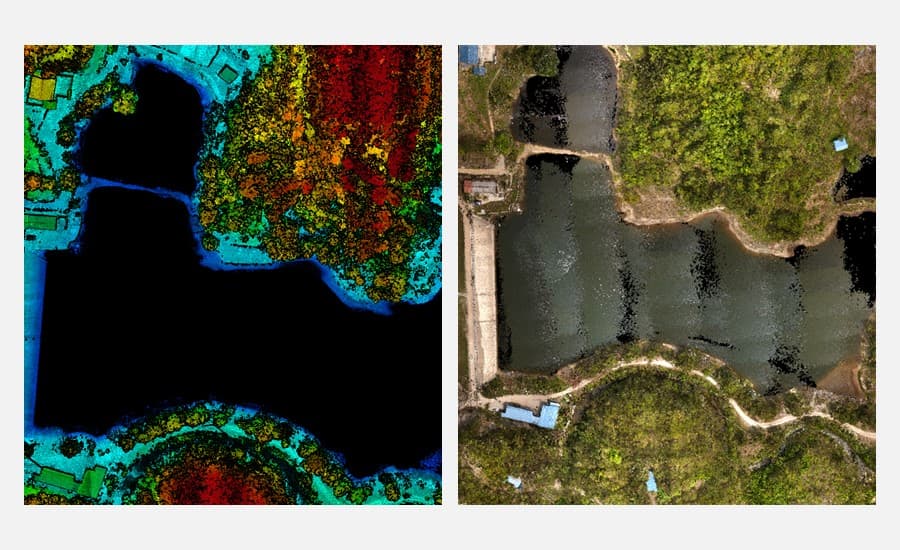
Figure 6. Original laser point cloud data (left) and colorized point cloud (right).
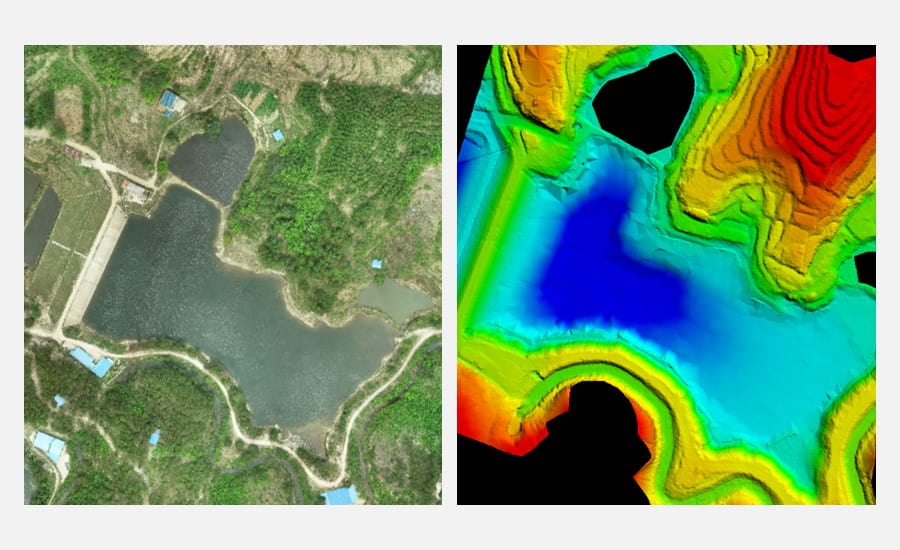
Figure 7. Reservoir DOM (left) and DEM (right) after data processing.
PHASE 3 – CALCULATING THE WATER RESERVOIR CAPACITY
At this stage, the virtual model of the reservoir was created. The water level in meters and capacity in cubic meters were efficiently and accurately calculated and presented on the diagram.
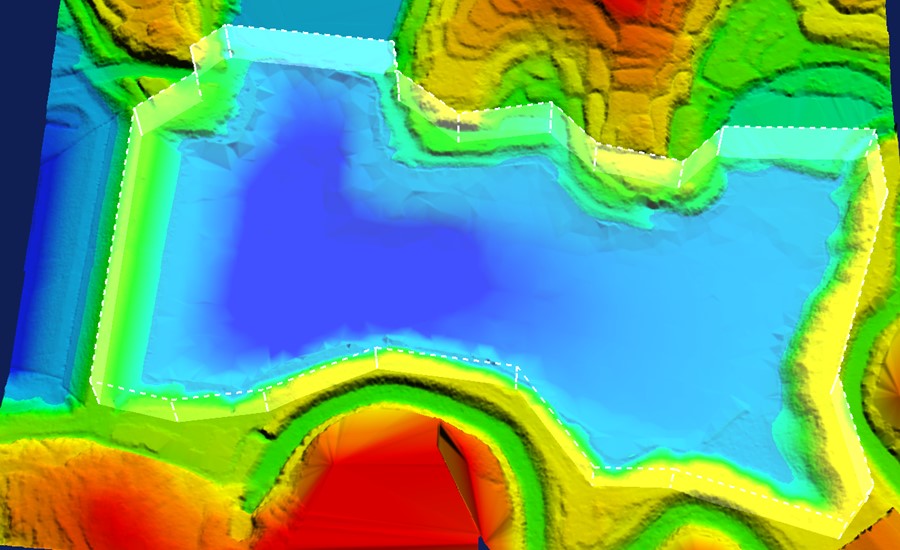
Figure 8. 3D modeling of the available water compared to the current water level.
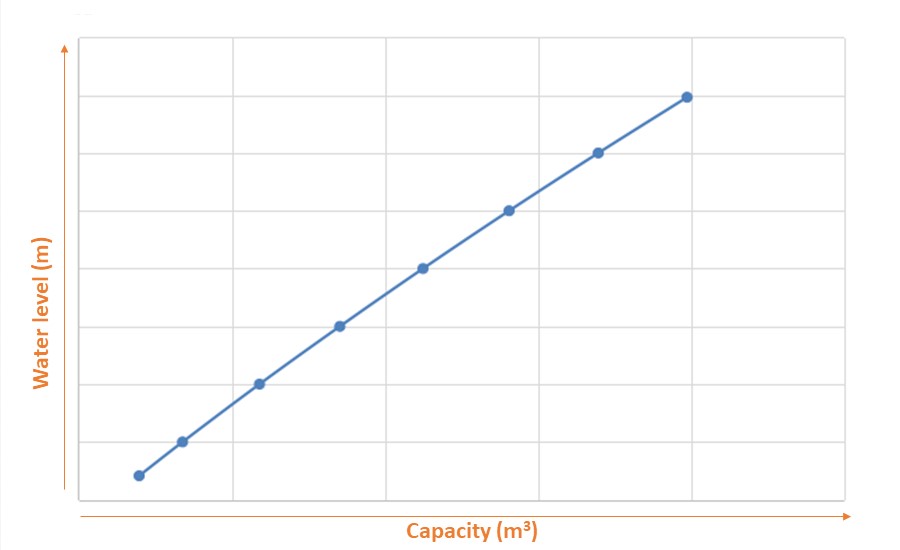
Figure 9. Diagram of the reservoir’s water capacity.
By using new technologies, such as LIDAR scanners, drones, and USVs, it is now possible to improve the level of accuracy and time spent on acquiring the reservoir's topography and calculating its storage capacity. As a result, survey costs are significantly reduced, and the efficiency of the long-term maintenance process is improved. With the reservoir's digital model, survey and mapping results can be enriched, and future developments can be simulated, monitored, and forecasted.
___
About CHCNAV
CHC Navigation (CHCNAV) creates innovative GNSS navigation and positioning solutions to make customers' work more efficient. CHCNAV products and solutions cover multiple industries such as geospatial, construction, agriculture, and marine. With a presence across the globe, distributors in more than 120 countries, and more than 1,500 employees, today CHC Navigation is recognized as one of the fastest-growing companies in geomatics technologies.


